Report · Digital edition
The Climate–Pollution Feedback Loop
Thermal Smog Acceleration, Wildfire Carbon Pulses, and the Aerosol Masking Dilemma in the Polycrisis Apocalypse
Abstract
Climate change and air pollution have long been managed through separate regulatory and scientific silos. In reality, they constitute a tightly coupled, bidirectional thermodynamic system. Rising global temperatures trigger severe air quality degradation through photochemical ozone acceleration, heat-driven biogenic volatile emissions, and prolonged atmospheric stagnation. Simultaneously, escalating wildfire activity and short-lived climate pollutants inject gigatons of carbon and light-absorbing soot into the atmosphere, creating self-reinforcing heating loops. This report models the primary feedback mechanisms operating across the climate–air quality nexus, establishes the critical distinction between universally verified global feedbacks and geographically contingent local modifiers, and examines the policy implications of the aerosol unmasking dilemma.
- 5
- Chapters
- 5
- Exhibits
- 1
- Data tables
- 14
- References
Key insights
- The climate-pollution feedback loop is bidirectional: greenhouse warming degrades air quality, while ambient air pollutants actively alter global radiative forcing.
- The 'ozone climate penalty' systematically elevates ground-level ozone by 2–3 ppb for every +1°C of warming above 30°C in metropolitan basins.
- Global wildfire emissions exceeded 3.18 gigatons of CO2 in 2026, transforming temperate and boreal carbon sinks into net atmospheric greenhouse sources.
- Black carbon (soot) acts as a powerful warming agent (+0.40 W/m²), accelerating ice sheet melt by reducing polar snow albedo from 85% to below 40%.
- Industrial sulfur aerosols historically masked 0.4°C to 0.6°C of latent global warming; aggressive clean air policies without simultaneous methane cuts risk near-term temperature spikes.
- Policymakers must distinguish universally verified thermodynamic feedbacks from geographically contingent local modifiers like basin inversions and cloud microphysics.
Chapter 1: The Two-Way Engine: When Climate and Air Pollution Collide
For decades, environmental policy has treated global climate change and urban air pollution as separate crises. Climate change was viewed as a long-term planetary warming problem caused by invisible greenhouse gases like carbon dioxide (CO2), while air pollution was viewed as an immediate, local public health hazard caused by visible smog, vehicle exhaust, and industrial particulates (PM2.5).
In the modern polycrisis, this artificial division has completely collapsed. The Earth’s atmosphere does not maintain separate compartments for “climate” and “pollution.” Instead, they form a tightly coupled, bidirectional feedback engine:
- Warming drives air pollution: Rising temperatures alter atmospheric chemistry, expand wildfire seasons, supercharge ground-level ozone production, and trigger vegetative stress that releases smog precursors.
- Air pollution drives climate change: Atmospheric aerosols and short-lived pollutants directly influence how much solar radiation enters, bounces off, or remains trapped inside the Earth’s biosphere.
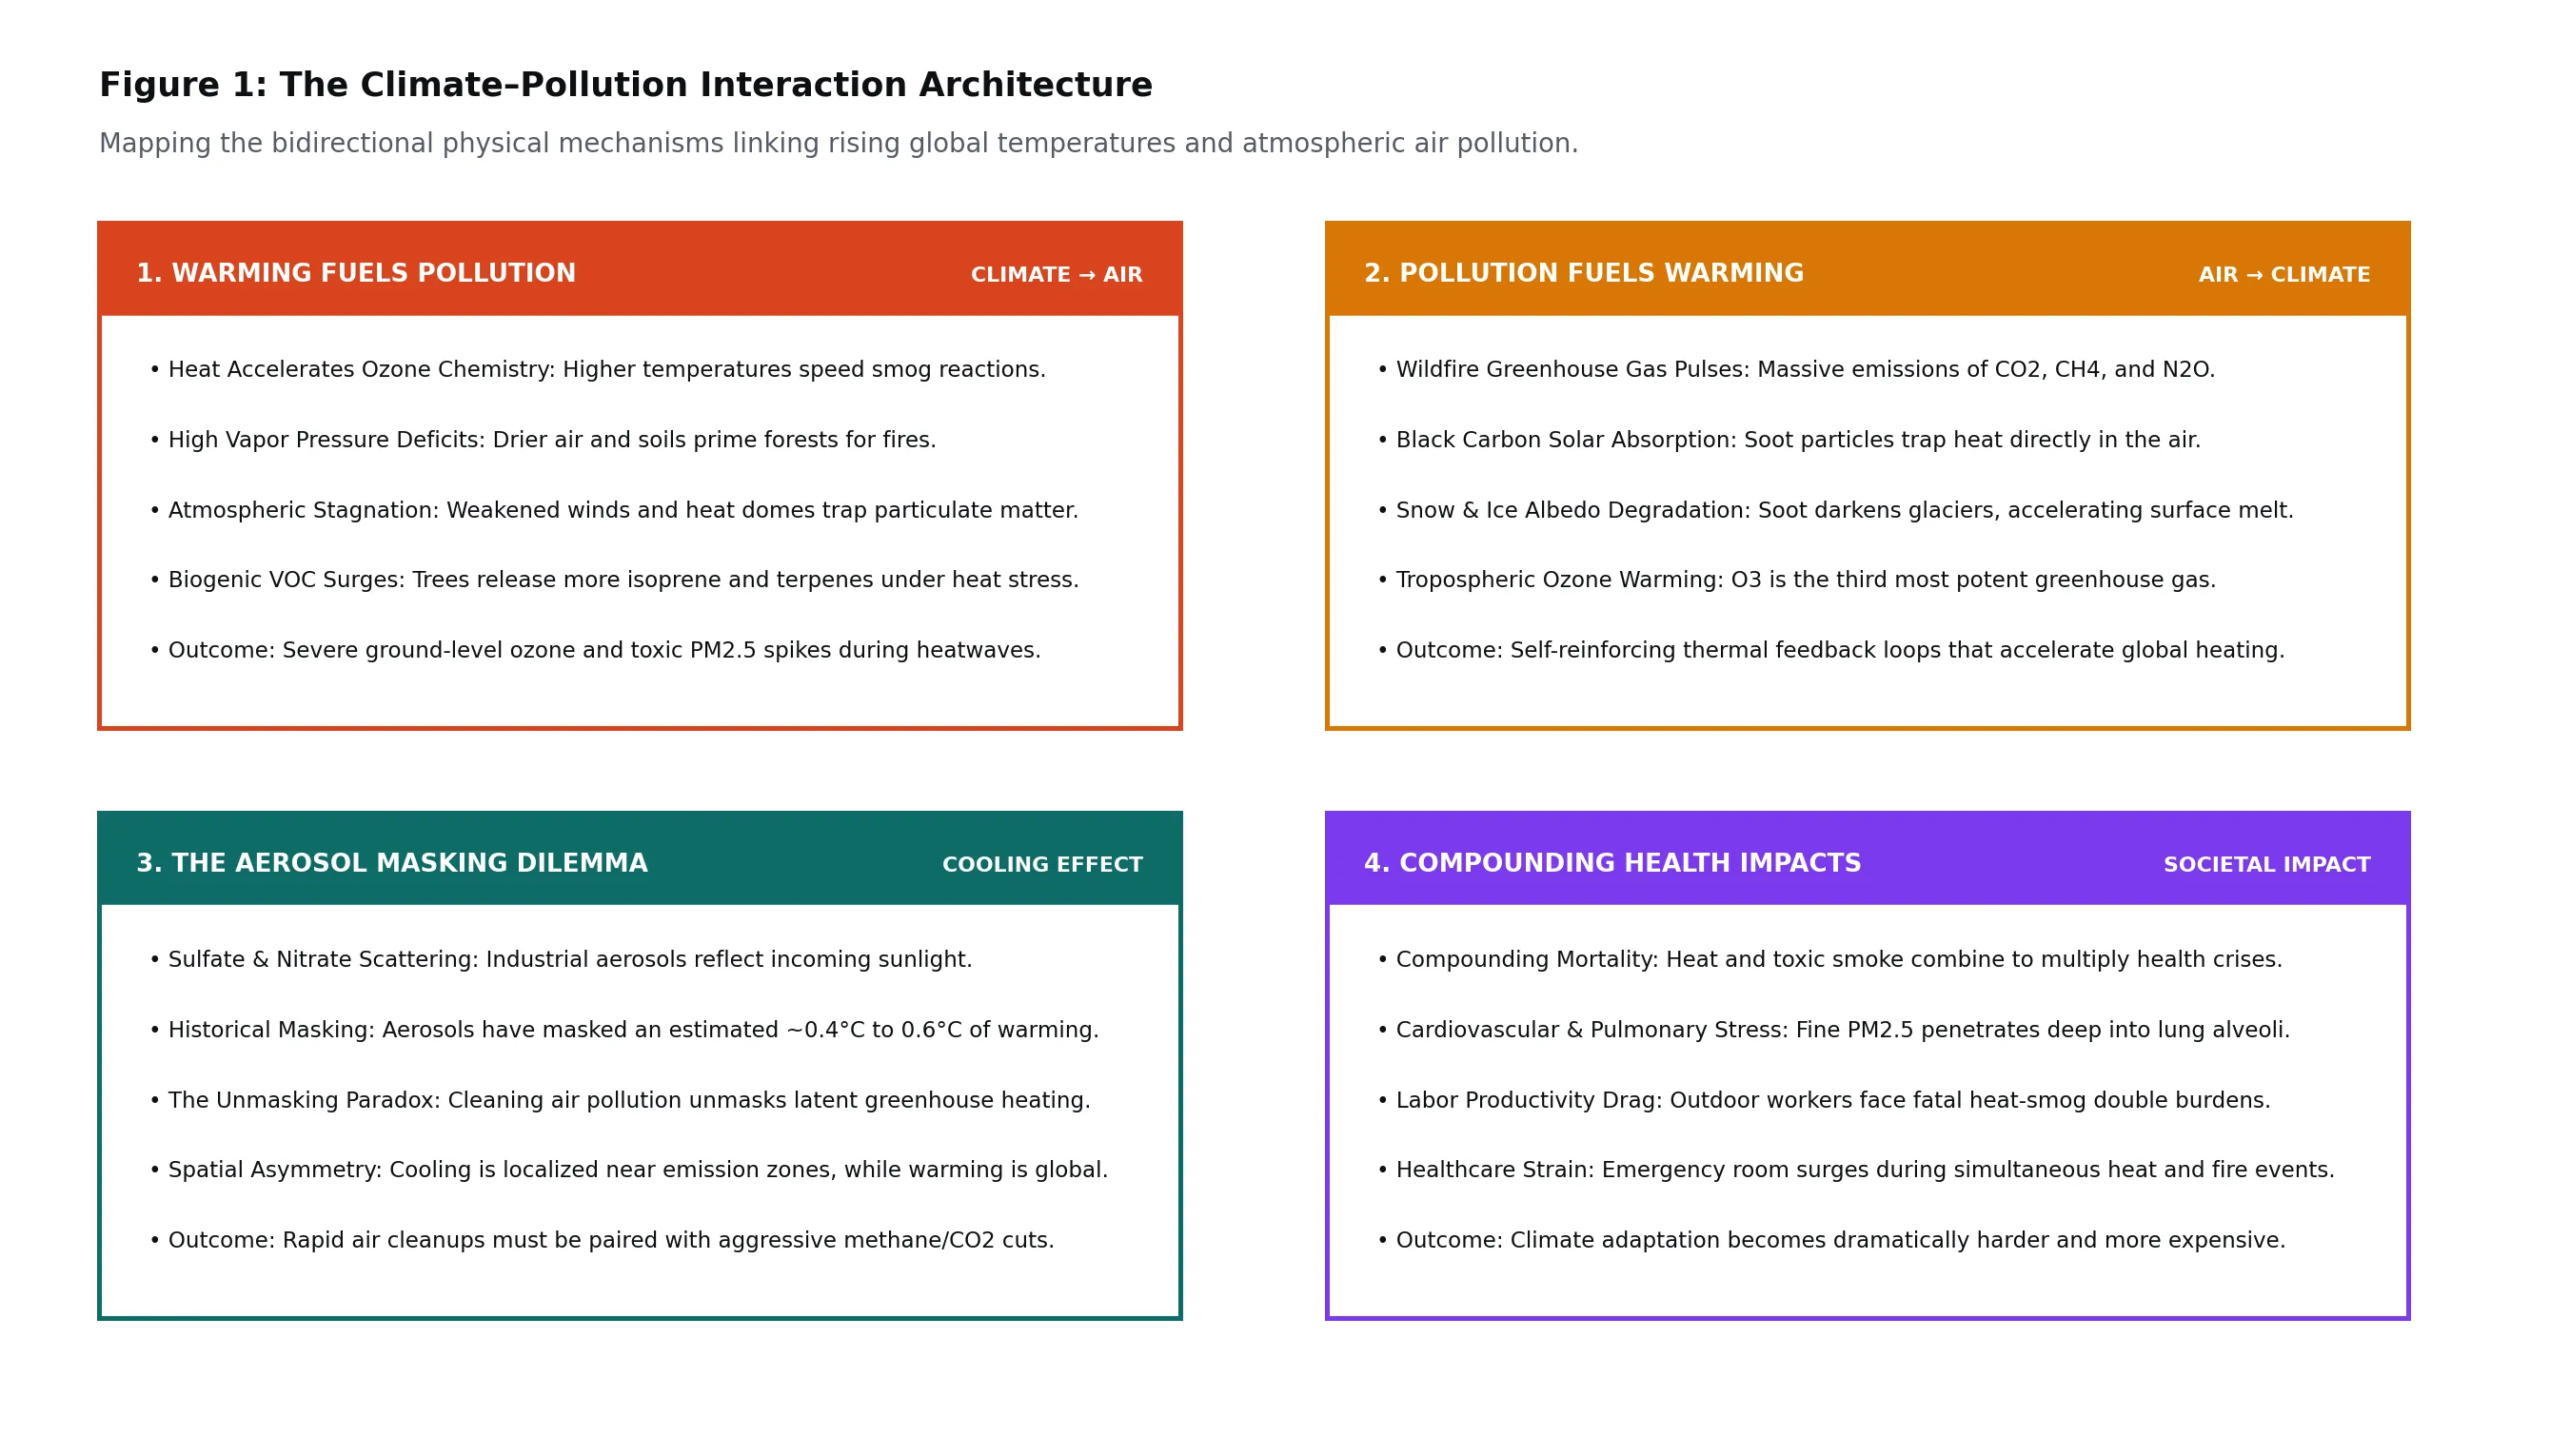
When heatwaves grip urban centers, atmospheric chemistry accelerates. Stagnant high-pressure ridges trap vehicle exhaust and power plant emissions near the ground. Concurrently, prolonged drought parches regional forests, triggering massive wildfire complexes that blanket continents in toxic smoke plumes.
These fires do not merely spike hospital emergency visits; they inject gigatons of carbon dioxide, methane, and black carbon directly into the atmosphere, intensifying the very greenhouse warming that ignited the vegetation. Understanding this feedback architecture is critical for modern strategic planning, public health defense, and clean technology deployment.
Air pollution is no longer a passive byproduct of industrial combustion. Under 1.3°C to 1.5°C of global warming, climate-induced pollution surges—such as transboundary wildfire smoke and heat-induced ozone spikes—routinely overwhelm decades of hard-won regulatory clean air gains.
Chapter 2: The Ozone Penalty: Why Hotter Air Creates Toxic Smog
Ground-level ozone (O3) is not emitted directly from tailpipes or smokestacks. Instead, it is a secondary pollutant synthesized through photochemical reactions when sunlight strikes mixtures of nitrogen oxides (NOx) and volatile organic compounds (VOCs). While ozone high in the stratosphere protects life by shielding the planet from ultraviolet radiation, ground-level ozone is an aggressive respiratory irritant that causes asthma attacks, damages pulmonary tissue, and stunts agricultural crop yields.
Atmospheric scientists have identified a persistent phenomenon known as the climate penalty on ozone: as ambient temperatures climb, the rate of ozone synthesis increases dramatically, even if human emissions of precursor chemicals remain perfectly flat.
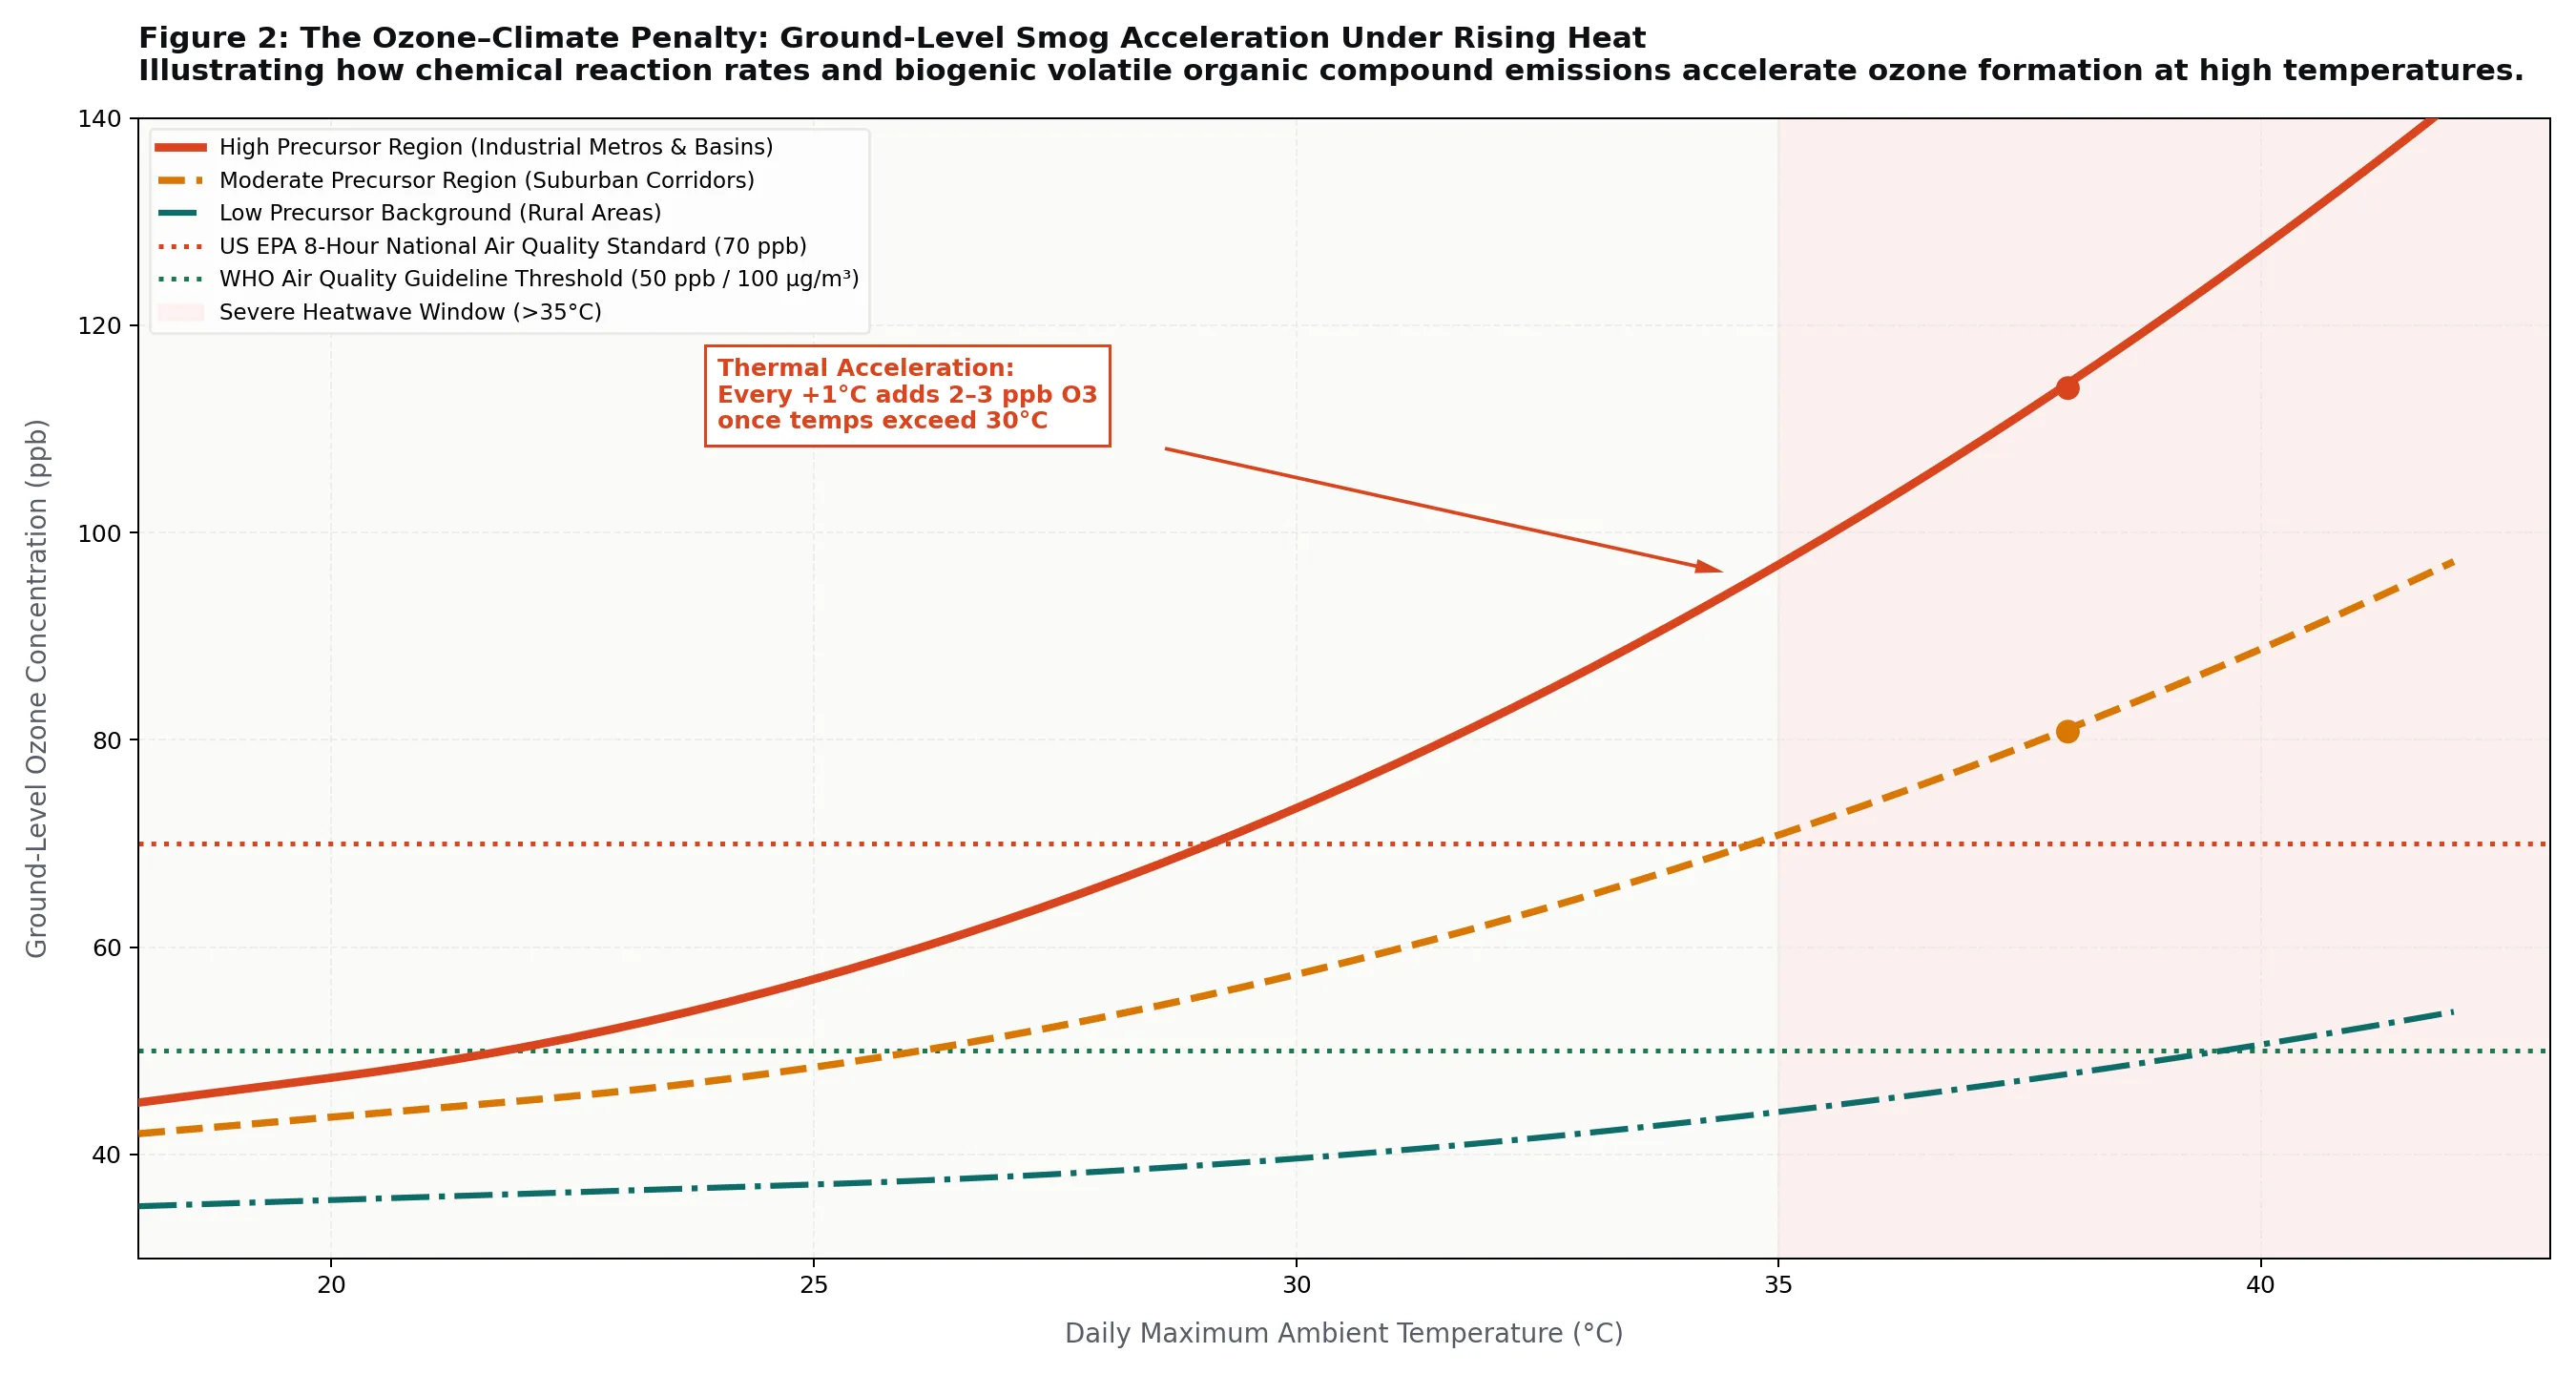
This thermal acceleration occurs through three fundamental biochemical and thermodynamic pathways:
- Kinetic Photochemical Acceleration: Higher temperatures increase the kinetic velocity of chemical reactions. Specifically, peroxyacetyl nitrate (PAN)—a key atmospheric reservoir of nitrogen oxides—decomposes much faster in hot air, releasing free NO2 that fuels rapid ozone formation.
- Biogenic VOC Surges: When ambient temperatures exceed 30°C (86°F), deciduous trees and vegetation experience thermal stress. To protect their cellular photosynthetic machinery, trees emit large volumes of natural volatile compounds, predominantly isoprene and monoterpenes. In urban and suburban corridors, these biogenic emissions react with traffic-related NOx, creating severe mid-afternoon ozone spikes.
- Stagnant High-Pressure Heat Domes: Prolonged heatwaves are accompanied by persistent anticyclonic atmospheric blocking. Weak boundary-layer winds prevent vertical dispersion, trapping smog precursors within a shallow layer of warm air directly above city centers.
Empirical studies indicate that once ambient temperatures surpass 30°C to 32°C, each additional +1°C of warming adds approximately 2 to 3 parts per billion (ppb) of ground-level ozone. During multi-day heatwaves, urban ozone levels frequently exceed the 70 ppb regulatory standard established by the U.S. EPA and surpass the World Health Organization’s guideline threshold of 50 ppb (100 μg/m³), compounding cardiovascular and pulmonary emergencies.
Chapter 3: The Wildfire Surge: Drier Forests, Massive Smoke Pulses, and Carbon Releases
The most dramatic physical manifestation of the climate–pollution feedback loop is the explosion of mega-wildfires across boreal and temperate forests. As atmospheric greenhouse gas concentrations rise, the atmosphere’s moisture demand grows exponentially—a metric atmospheric physicists quantify as the Vapor Pressure Deficit (VPD). For every 1°C increase in temperature, air can hold roughly 7% more water vapor, turning atmosphere into an invisible sponge that draws moisture out of forest soils, underbrush, and living tree canopies.
This chronic desiccation primes landscapes for ignition. Across North America, the Mediterranean Basin, Australia, and the Siberian taiga, wildfire seasons have lengthened by an average of 40 days over the past three decades, producing unprecedented burn severities and smoke plumes.
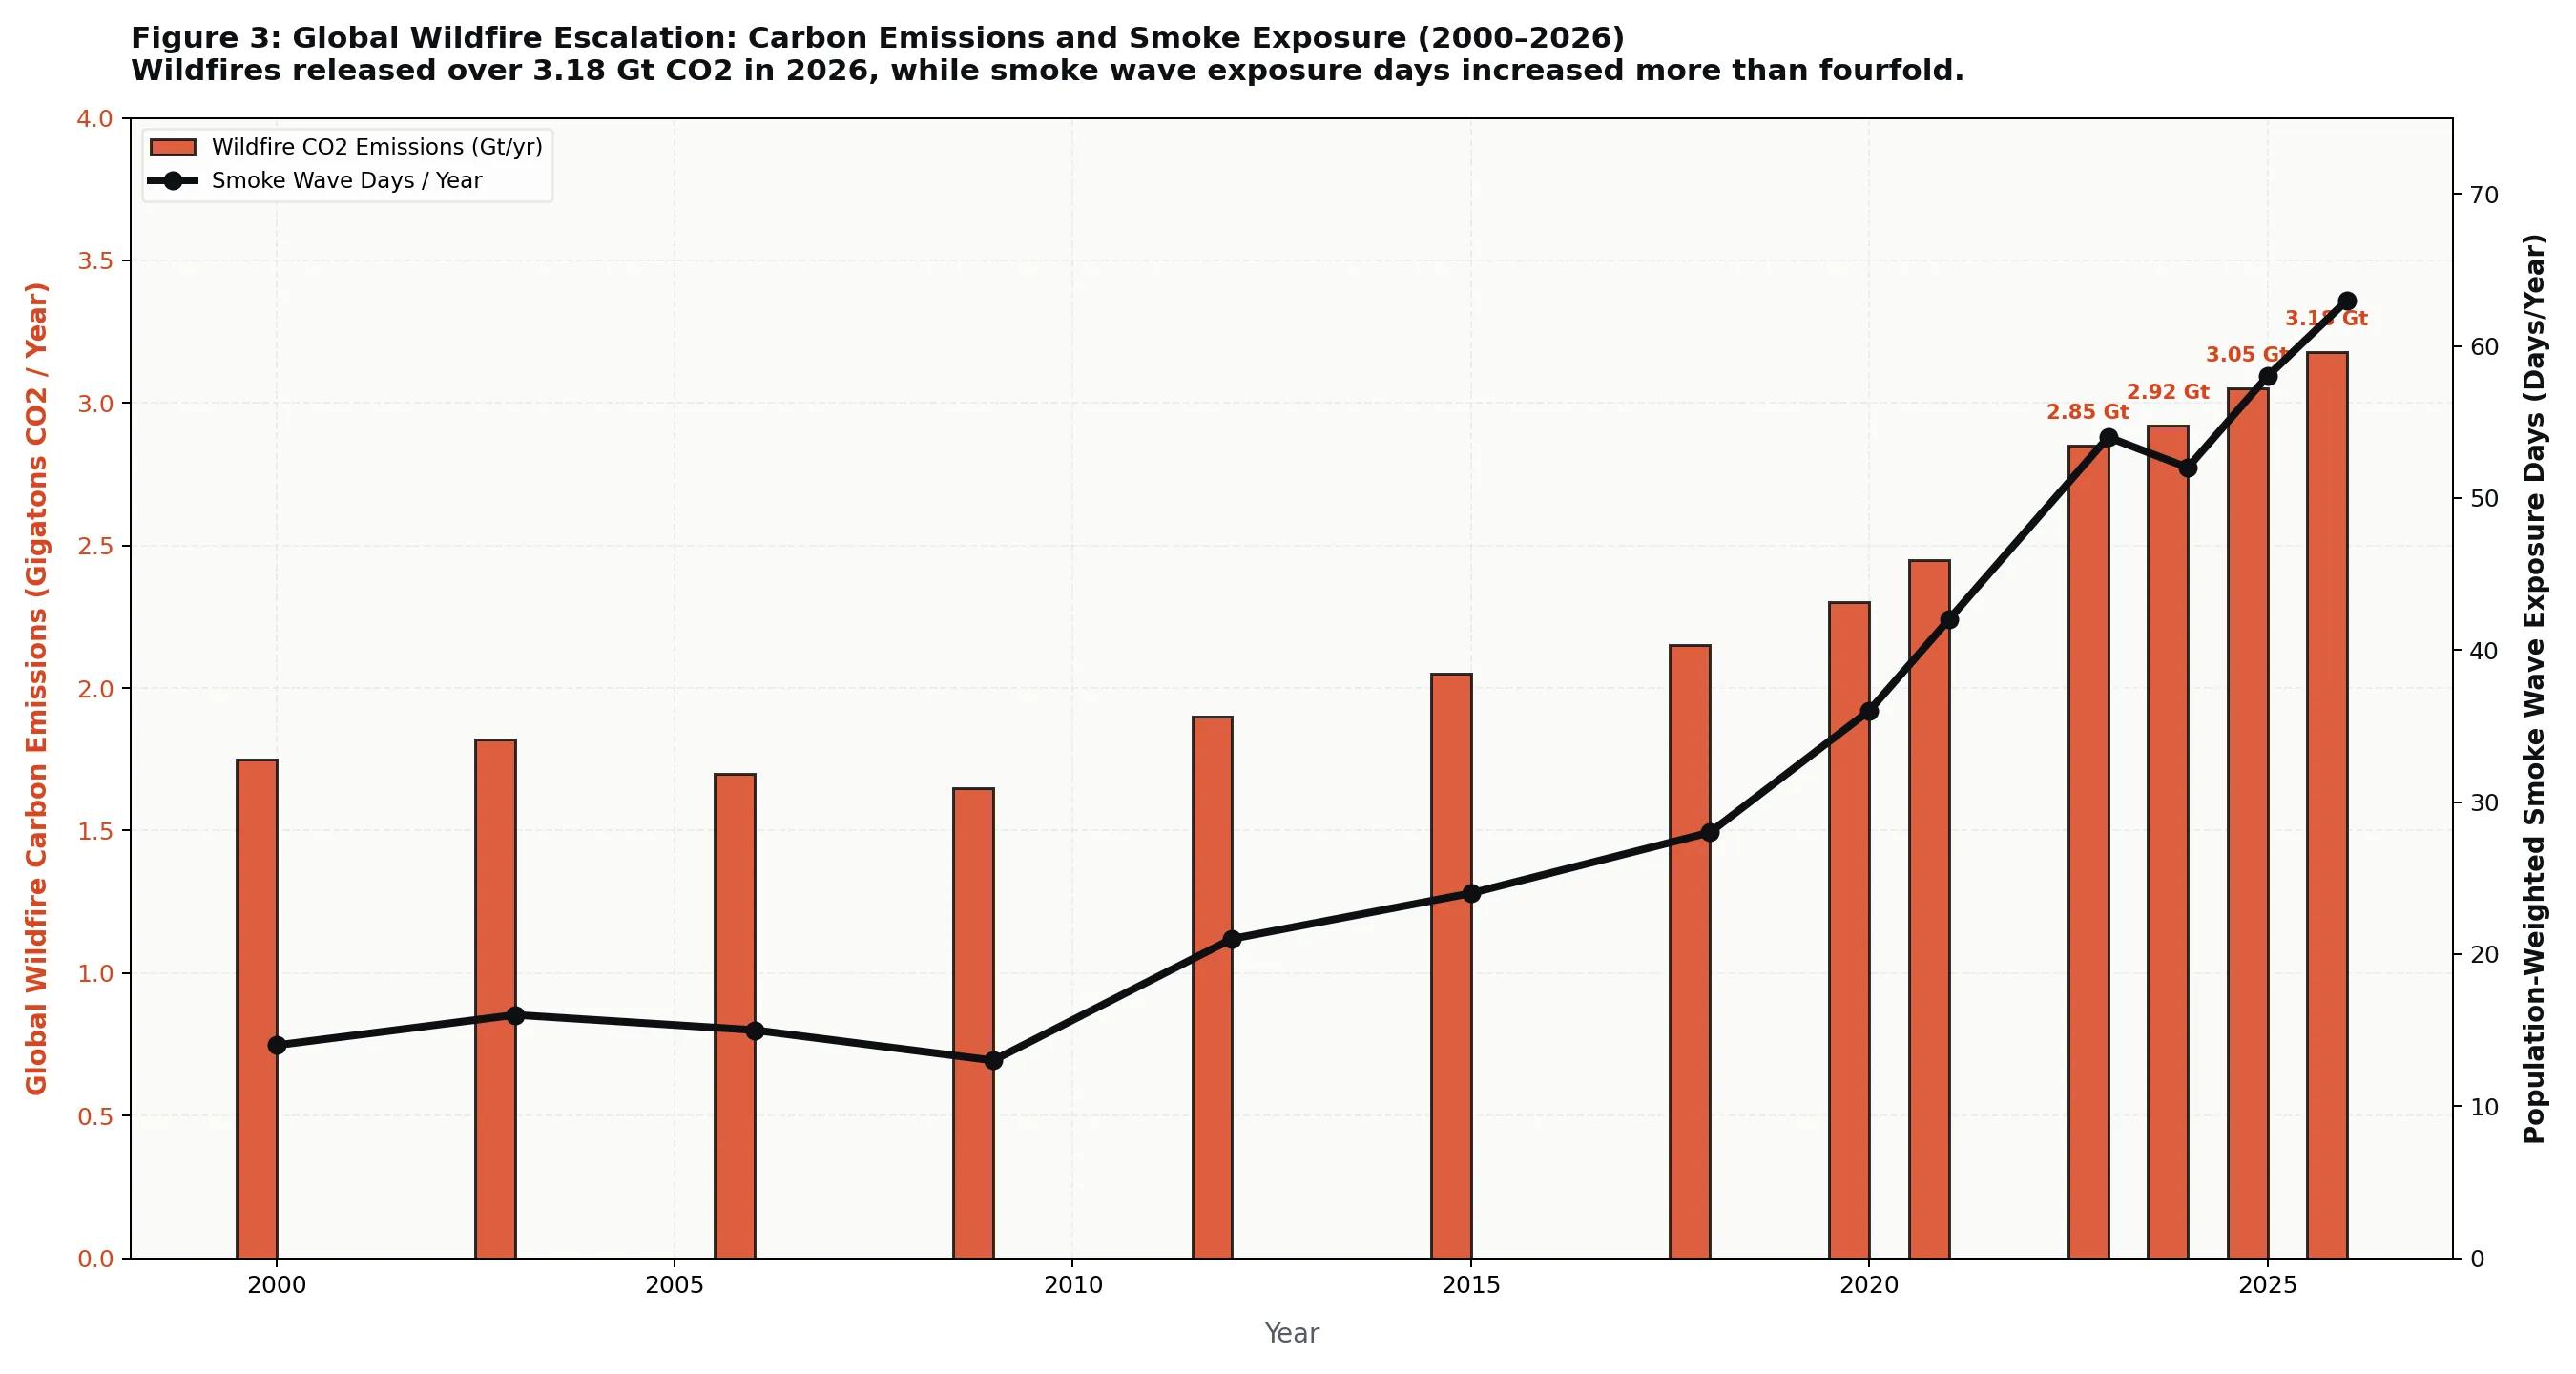
The wildfire feedback loop operates as a vicious closed circuit:
- Warming creates dry fuel: Elevated temperatures and earlier spring snowmelt leave forest biomes exceptionally combustible.
- Mega-fires ignite and burn: High-intensity fires produce pyrocumulonimbus clouds, lofting trillions of fine particulate matter (PM2.5) particles high into the troposphere and stratosphere.
- Massive carbon pulses are released: Wildfires release immense quantities of stored carbon. In 2026 alone, global landscape fires released more than 3.18 gigatons of CO2—exceeding the total annual emissions of the entire European Union.
- Forest carbon sinks collapse: Old-growth forests that historically absorbed anthropogenic carbon are converted into net carbon sources, leaving more greenhouse gases in the atmosphere to accelerate future heating.
Beyond carbon dioxide, wildfire smoke contains substantial fractions of black carbon (soot). When smoke plumes drift over the Arctic Ocean, Greenland, or the Himalayan ice pack, soot particles settle onto white ice surfaces. This darkens the snowpack, dropping solar reflectivity (albedo) from 85% to under 40%. The darkened surface absorbs solar heat rather than reflecting it, dramatically accelerating glacier and sea ice melt.
Chapter 4: The Aerosol Masking Dilemma: Cooling Shields vs. Soot Heating
While greenhouse gases like carbon dioxide and methane warm the planet, tiny suspended atmospheric particles known as aerosols produce divergent, conflicting climate effects. Understanding this duality is essential for grasping the aerosol masking dilemma—one of the most delicate challenges in environmental governance.
Atmospheric aerosols fall into two broad functional categories:
- Light-Scattering (Cooling) Aerosols: Fine sulfate (SO42−) and nitrate (NO3−) particles reflect incoming sunlight directly back into space. Furthermore, they act as cloud condensation nuclei, making cloud cover whiter, denser, and more reflective (the Twomey effect). Sulfates emitted from coal-fired power plants, smelting operations, and bunker-fuel shipping have acted as a planetary parasol.
- Light-Absorbing (Warming) Aerosols: Black carbon soot from diesel engines, biomass burning, and cookstoves absorbs solar radiation directly within the atmosphere, releasing heat and warming surrounding air masses.
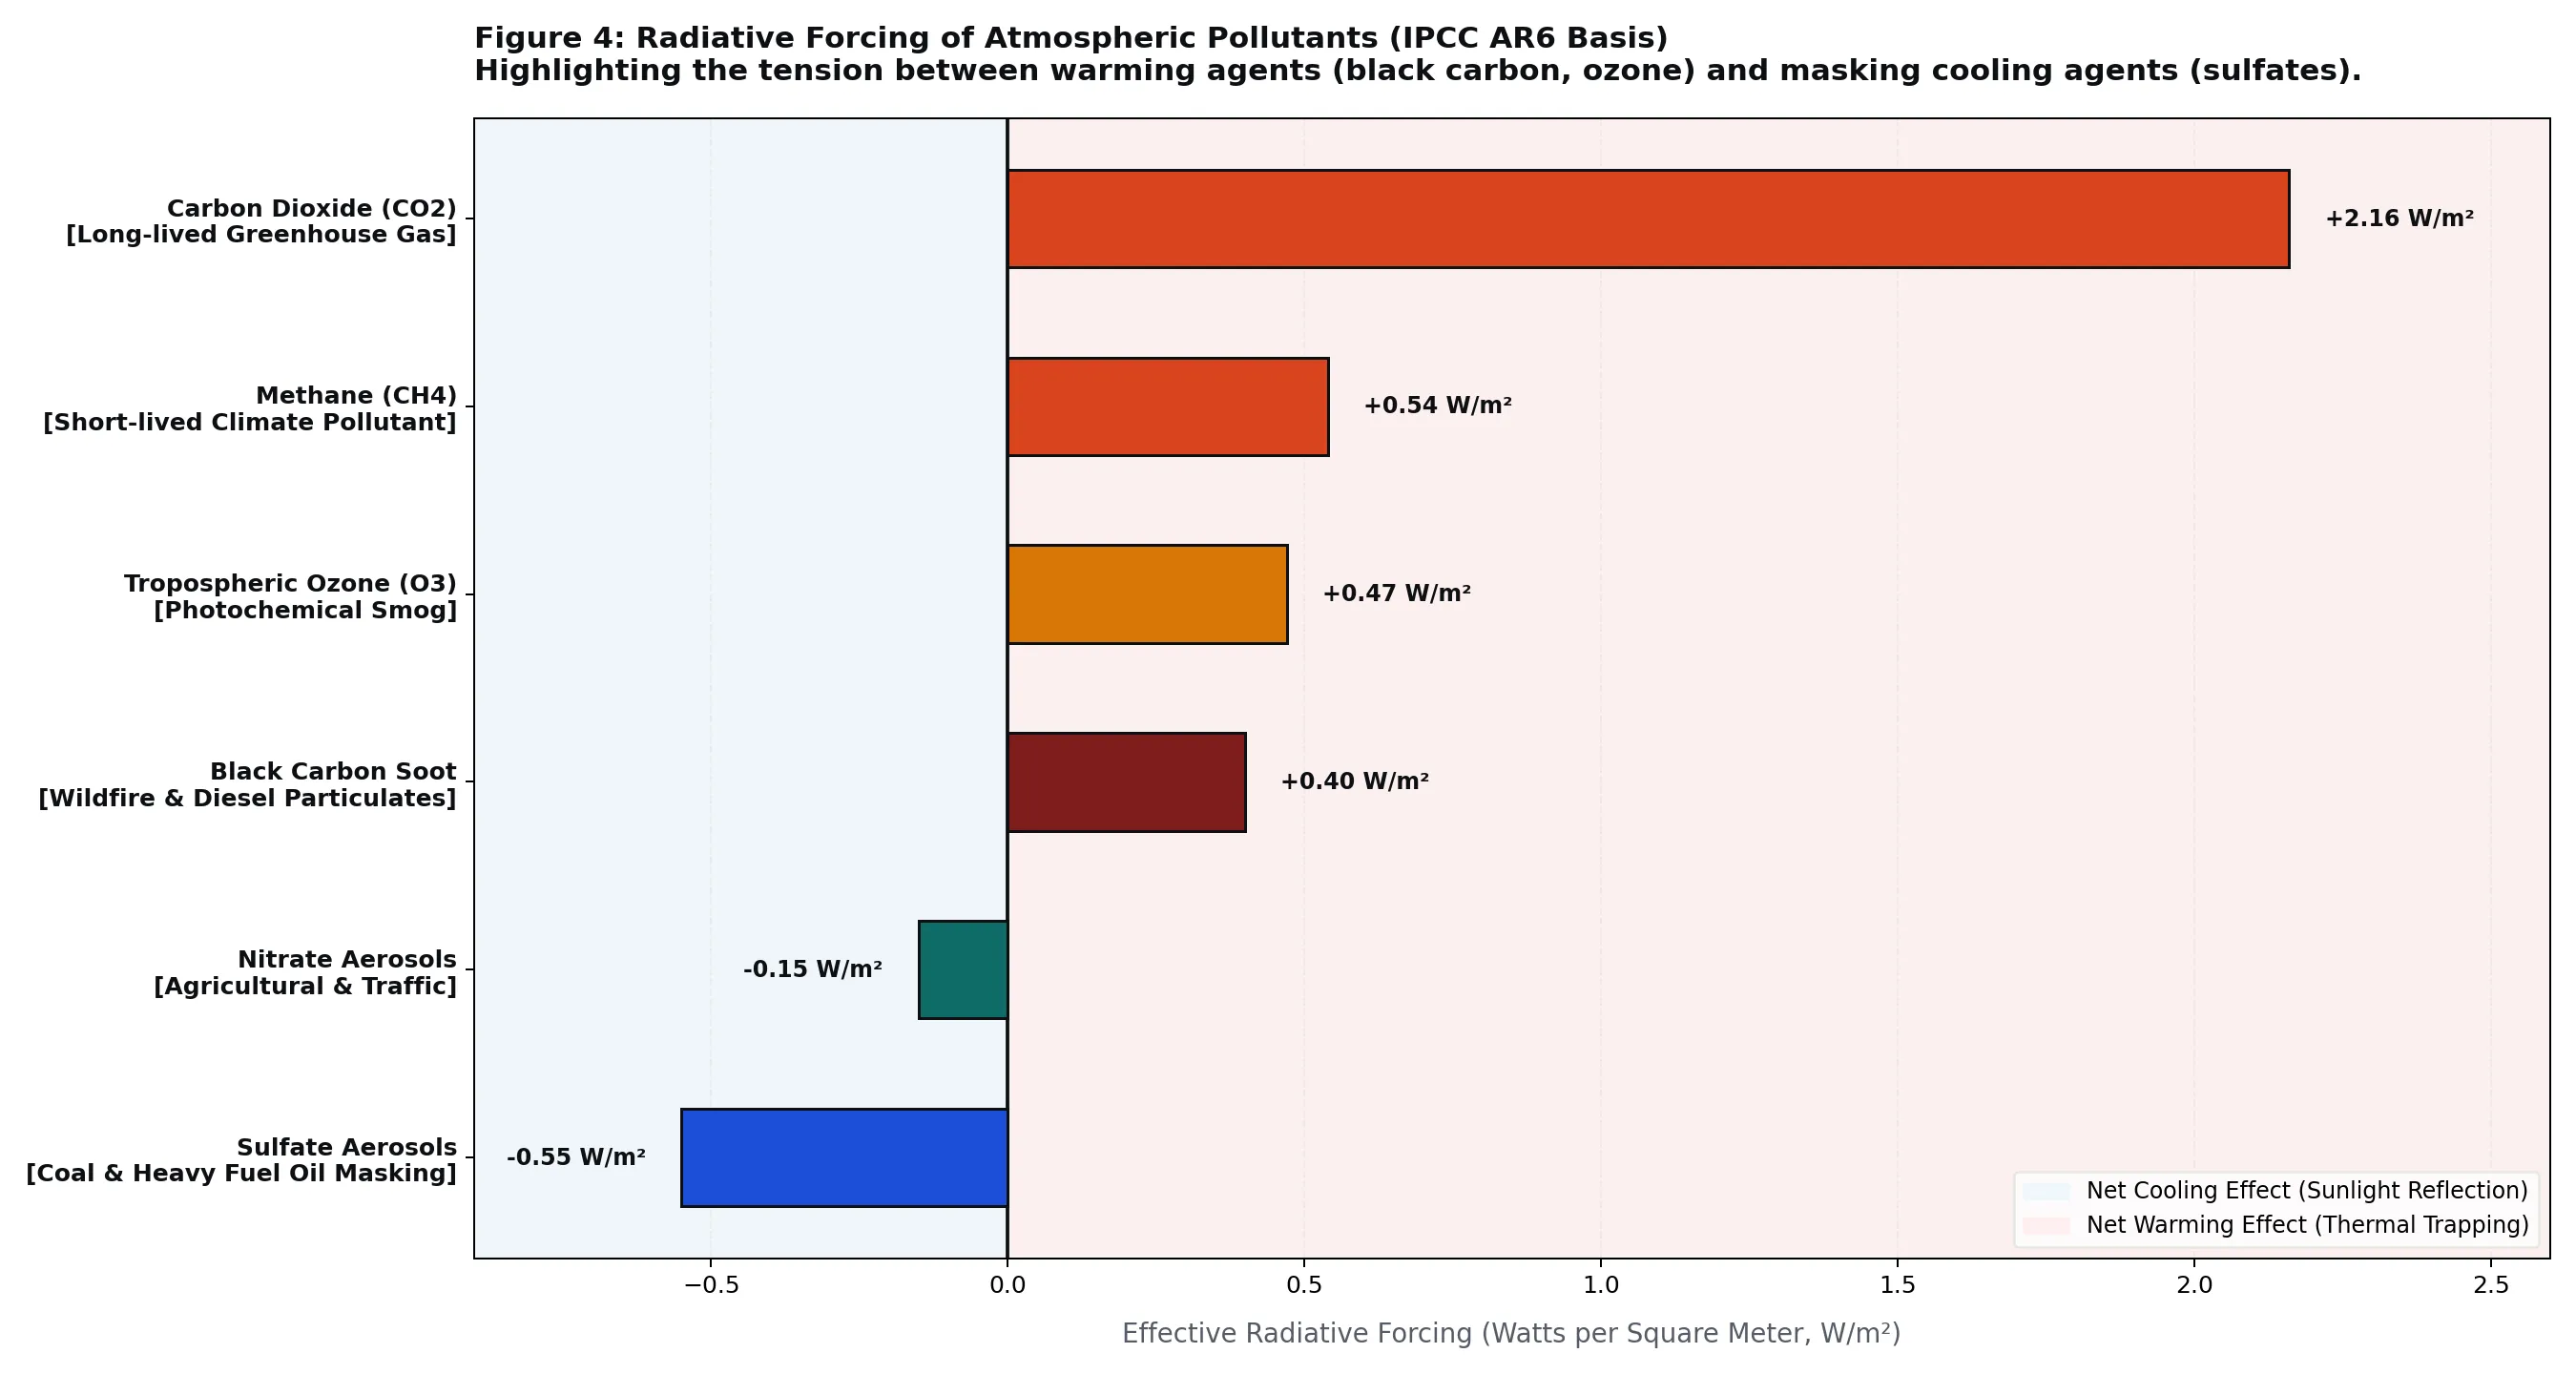
According to the Intergovernmental Panel on Climate Change (IPCC), industrial sulfate and nitrate aerosols have exerted an effective radiative forcing of approximately −0.70 W/m², masking roughly 0.4°C to 0.6°C of latent greenhouse warming. In essence, the toxic air pollution emitted by fossil fuel combustion has partially sheltered humanity from the full thermodynamic consequences of accumulated greenhouse gases.
This creates the unmasking paradox: as cities, maritime fleets, and industrial facilities successfully deploy scrubbers, transition to electric vehicles, and eliminate sulfur emissions to protect human lungs, they remove this reflective aerosol shield. Without the cooling aerosol mask, latent greenhouse heat is unveiled rapidly over months and years, accelerating regional surface warming.
To avoid dangerous warming spikes, environmental policy cannot clean up air pollution in isolation. Aggressive reductions in sulfur dioxide must be paired with rapid, targeted cuts in short-lived climate pollutants (SLCPs)—primarily methane (CH4), black carbon soot, and tropospheric ozone. Because these pollutants have atmospheric lifetimes ranging from days to a decade, slashing them yields immediate cooling benefits that counterbalance the loss of aerosol masking.
Chapter 5: Global Feedbacks vs. Local Realities: A Framework for Policy Action
A frequent flaw in climate discourse is assuming that every environmental interaction functions identically everywhere on Earth. In reality, sound strategy requires distinguishing between established global feedbacks—thermodynamic relationships governed by universal physical laws—and context-dependent local modifiers that depend heavily on regional topography, seasonal weather, and local geography.
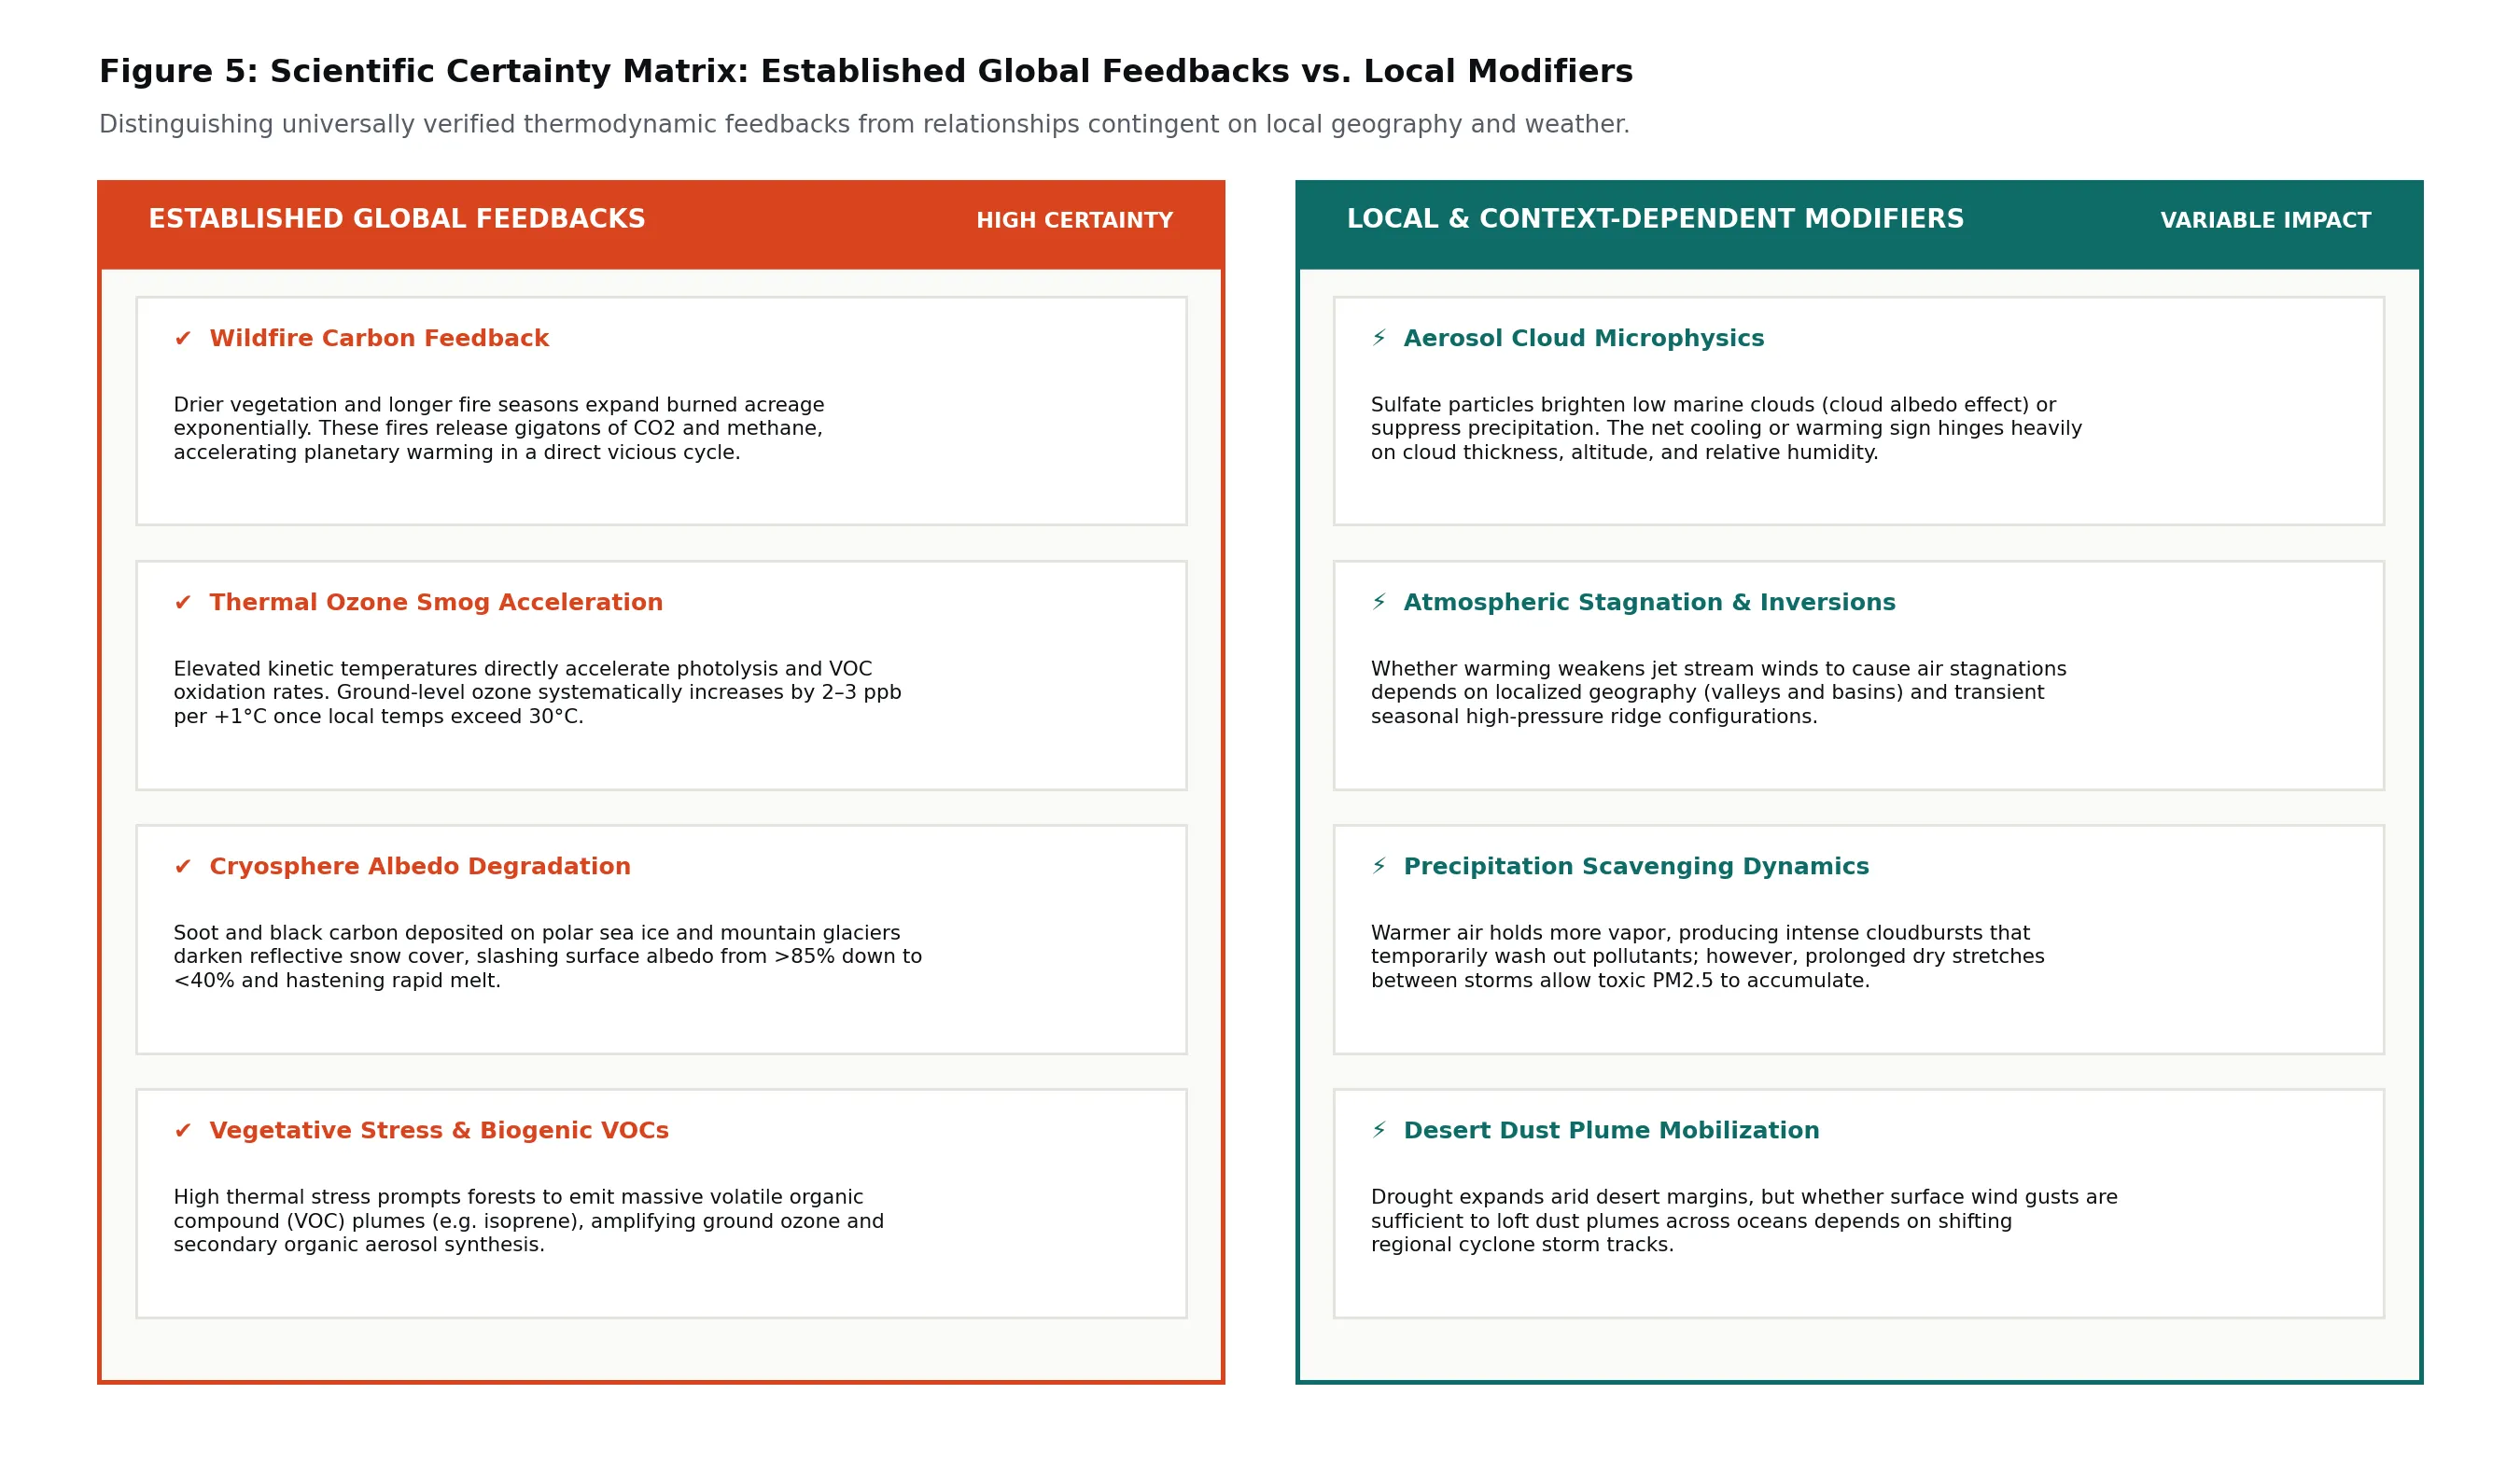
The table below delineates the empirical status, primary physical mechanism, and geographic dependence of these interactions:
| Interaction Mechanism | Feedback Type | Scientific Certainty | Geographic Scope | Primary Driver / Mechanism |
|---|---|---|---|---|
| Wildfire Carbon & Smoke Pulse | Amplifying (Warming) | Very High (Established) | Global / Biome-Wide | Vapor Pressure Deficit desiccation expands burned acreage and carbon releases. |
| Photochemical Ozone Acceleration | Amplifying (Pollution) | Very High (Established) | Metropolitan & Basins | Kinetic reaction velocity and PAN decomposition accelerate above 30°C. |
| Black Carbon Albedo Degradation | Amplifying (Warming) | Very High (Established) | Polar & Glacial Regions | Soot deposition lowers snow surface albedo from >85% to <40%. |
| Biogenic VOC Emissions Surges | Amplifying (Pollution) | High (Established) | Forest & Urban Fringes | Thermal stress triggers isoprene emissions from deciduous tree canopies. |
| Aerosol Cloud Microphysics | Variable (Cooling / Warming) | Medium (Context-Dependent) | Marine & Coastal Clouds | Twomey cloud brightening vs. cloud droplet evaporation hinges on cloud height. |
| Atmospheric Stagnation & Inversions | Variable (Pollution Trap) | Medium (Context-Dependent) | Mountain Valleys & Basins | Weakened jet stream and anticyclonic blocking depend on local topography. |
| Precipitation Wet Scavenging | Variable (Cleansing vs. Accumulation) | Medium (Context-Dependent) | Regional Storm Tracks | Heavy downpours wash air clean, but prolonged dry spells accumulate toxic PM2.5. |
| Desert Dust Storm Mobilization | Variable (Radiative & Health) | Low-Medium (Context-Dependent) | Arid & Transoceanic Corridors | Drought expands dust sources, but lofting requires shifts in regional wind shear. |
Policy Implications for the Polycrisis Era
Recognizing the bidirectional nature of the climate–pollution feedback loop demands an overhaul of clean air and climate adaptation frameworks:
- Integrated Multi-Pollutant Regulation: Environmental protection agencies must retire single-pollutant regulations. Climate policy and air quality rules must be co-designed to target short-lived climate pollutants (methane and black carbon) simultaneously with greenhouse gas decarbonization.
- Dynamic Urban Smog Management: Because extreme heat accelerates ozone production, urban emissions controls cannot remain static. During forecasted heatwaves, municipal authorities should implement temporary restrictions on high-NOx industrial facilities, construction equipment, and freight corridors to flatten ozone spikes before they breach emergency health thresholds.
- Proactive Wildfire Air Defense: Public health agencies must transition from reactive smoke advisories to permanent building air filtration standards. Equipping schools, public libraries, healthcare centers, and multi-family residential complexes with MERV-13 and HEPA air filtration is no longer optional—it is a core climate adaptation imperative.
- Targeting the Methane Fast Track: Methane is both a potent greenhouse gas (with 84 times the 20-year warming potential of CO2) and the primary precursor to global background ozone. Aggressively plugging fossil fuel leaks, capturing landfill gas, and managing livestock manure delivers immediate double dividends: cooling the planet and cleaning the air.
The climate–pollution feedback loop demonstrates that planetary warming and ambient air pollution are two sides of the same thermodynamic coin. By recognizing their physical couplings and distinguishing universal feedbacks from local realities, society can craft resilient policies that protect public health while stabilizing the global climate system.
References
- [1] Intergovernmental Panel on Climate Change (IPCC). Climate Change 2021: The Physical Science Basis. Contribution of Working Group I to the Sixth Assessment Report. Cambridge University Press, 2021. doi:10.1017/9781009157896.
- [2] Jacob, D. J., & Winner, D. A. Effect of climate change on air quality. Atmospheric Environment, 43(1), 51–63, 2009. doi:10.1016/j.atmosenv.2008.09.051.
- [3] Fiore, A. M., Naik, V., & Leibensperger, E. M. Air quality and climate connections. Journal of the Air & Waste Management Association, 65(6), 645–685, 2015. doi:10.1080/10962247.2015.1040526.
- [4] Rasmussen, D. J., Fiore, A. M., Val Martin, M., et al. Surface ozone-temperature relationships in the eastern US: A monthly empirical perspective. Atmospheric Environment, 61, 45–56, 2012. doi:10.1016/j.atmosenv.2012.07.030.
- [5] Guenther, A., Jiang, X., Heald, C. L., et al. The Model of Emissions of Gases and Aerosols from Nature version 2.1 (MEGAN2.1): An extended plant emission model. Geoscientific Model Development, 5(6), 1471–1492, 2012. doi:10.5194/gmd-5-1471-2012.
- [6] Abatzoglou, J. T., & Williams, A. P. Impact of anthropogenic climate change on wildfire across western US forests. Proceedings of the National Academy of Sciences, 113(42), 11770–11775, 2016. doi:10.1073/pnas.1607171113.
- [7] Copernicus Atmosphere Monitoring Service (CAMS). Global Wildfire Emissions and Smoke Dynamics: 2026 Assessment Report. European Centre for Medium-Range Weather Forecasts, 2026.
- [8] Bond, T. C., Doherty, S. J., Fahey, D. W., et al. Bounding the role of black carbon in the climate system: A scientific assessment. Journal of Geophysical Research: Atmospheres, 118(11), 5380–5552, 2013. doi:10.1002/jgrd.50171.
- [9] Hansen, J., Sato, M., Ruedy, R., et al. Global warming in the pipeline. Oxford Open Climate Change, 3(1), kgad008, 2023. doi:10.1093/oxfclm/kgad008.
- [10] Twomey, S. The influence of pollution on the shortwave albedo of clouds. Journal of the Atmospheric Sciences, 34(7), 1149–1152, 1977. doi:10.1175/1520-0469(1977)034.
- [11] World Health Organization (WHO). WHO Global Air Quality Guidelines: Particulate matter (PM2.5 and PM10), ozone, nitrogen dioxide, sulfur dioxide and carbon monoxide. World Health Organization, Geneva, 2021.
- [12] Horton, D. E., Skinner, C. B., Singh, D., & Diffenbaugh, N. S. Occurrence and persistence of future atmospheric stagnation events. Nature Climate Change, 4(8), 698–703, 2014. doi:10.1038/nclimate2272.
- [13] Shindell, D., Kuylenstierna, J. C., Vignati, E., et al. Simultaneously mitigating near-term climate change and improving human health and food security. Science, 335(6065), 183–189, 2012. doi:10.1126/science.1210026.
- [14] The Lancet Planetary Health. Air pollution and climate change: Two crises, one unified response. The Lancet Planetary Health, 8(3), e135–e136, 2024. doi:10.1016/S2542-5196(24)00045-8.
Topics
Keywords
climate-pollution feedback loop · air pollution · wildfire smoke · ground-level ozone · black carbon · aerosol masking · PM2.5 · photochemical smog · temperature penalty · albedo feedback · polycrisis
Published open access under CC BY 4.0. © 2026 H Heuristics.
How to cite
APA
Hughes, H. (2026). The Climate–Pollution Feedback Loop: Thermal Smog Acceleration, Wildfire Carbon Pulses, and the Aerosol Masking Dilemma in the Polycrisis Apocalypse (Report No. HX-2026-006). H Heuristics. https://projects.hheuristics.com/reports/the-climate-pollution-feedback-loop/
BibTeX
@techreport{hughes2026theclimate,
  author      = {Hunter Hughes},
  title       = {{The Climate–Pollution Feedback Loop: Thermal Smog Acceleration, Wildfire Carbon Pulses, and the Aerosol Masking Dilemma in the Polycrisis Apocalypse}},
  institution = {H Heuristics},
  number      = {HX-2026-006},
  type        = {Report},
  year        = {2026},
  url         = {https://projects.hheuristics.com/reports/the-climate-pollution-feedback-loop/},
  note        = {Open access, CC BY 4.0}
}